
AI Agents For Finance
Making 10-K analysis less boring: Featuring CVNA

Intro:
Given it’s a market holiday I figured you may be bored after the exciting past week, so time for another fully AI written article!
What I’m doing is essentially creating “AI agents” that follow a workflow checklist to create detailed modular investment research. What does that mean? First let’s talk some brief context.
Some of you may have heard of Rogo or similar chatbot focused tools. My opinion is that those can be very bad, because prompting models and context loading is still very much required. A very common complaint with chatbot focused models is hallucinations or misinterpretations of instructions. These are largely avoidable problems, but prompting skills are not something the average analyst/PM is spending a ton of time on. Additionally, actual good prompting for longer form tasks is often multi-step and requires massaging of context, not fun things to do for humans.
The solution in my view is to basically read the minds of analysts and have AI copy their workflows to rapidly accelerate content consumption. Basically skip the prompting, proactively create and deliver reports. Like sell-side, but many orders of magnitude cheaper and faster.
The text below is the example output of my “AI agent” for 10-K analysis, run on Carvana’s filings. I tried to define at a high level a bunch of topics like “What does the company do” “How does the company make money”, “What is the track record of capital allocation”, “What has changed since the prior year”. Essentially the same things I’d be looking at myself. What’s cool is I can chunk these out separately. You already know what the company does and don’t need an overview? Sure thing, easy to not include. You want to know changes in the “Risks” section since last year? That can be delivered before your analyst even opens the document. Cool stuff!
Our website will soon have these types of reports in a “closed alpha” type deal covering CVNA/Mag-7/LULU. Once we’re happy with those, ideally we can cover pretty much anything that’s listed publicly. The goal is to provide analysis of filings, related industry reports, earnings calls, alternative data, catalysts, expert calls, etc.
Ambitious, still very early, but I’m excited. If you’re interested in following along, feel free to subscribe to this blog. If you’d like to alpha test, feel free to shoot me a DM or reply to this email. Cheers.
High Level Summary:
The Bull Case (Potential Long Position)
A long position in Carvana would be supported by the company's significant financial turnaround, demonstrated operational leverage, and large market opportunity.
Financial Turnaround and Profitable Growth: After a challenging period, Carvana shifted its focus to "profitable growth" in 2024. This is evidenced by a 33.1% increase in retail units sold and a 26.9% increase in total revenue for 2024. Profitability has improved substantially, with net income growing to $404 million in 2024 from a net loss of $2.894 billion in 2022.
Margin Expansion and Operational Leverage: Key profitability metrics have expanded significantly. Total gross profit per unit (GPU) reached $6,908 in 2024, up from $3,022 in 2022. The company has also demonstrated operating leverage, with Selling, General & Administrative (SG&A) costs per retail unit decreasing from $5,741 in 2023 to $4,501 in 2024.
Competitive Moat and Infrastructure: Carvana believes its "Purpose-Built Vertically Integrated E-commerce Platform" provides a significant cost advantage over traditional dealers. This is supported by proprietary technology, including 41 issued U.S. patents , a national logistics network, and scaled infrastructure with the capacity to recondition over 1 million vehicles annually.
Brand and Market Opportunity: The company benefits from strong brand recognition, driven by its unique car vending machines and a high average customer satisfaction rating of 4.7 out of 5 stars. The U.S. used car market is large and highly fragmented, with the top 10 retailers accounting for less than 10% of market share, presenting a substantial opportunity for disruption and growth.
Strengthened Balance Sheet: Carvana has improved its financial position by reducing total debt to $5.5 billion in 2024 from $6.0 billion in 2023 and increasing its cash and cash equivalents to $1.716 billion.
The Bear Case (Potential Short Position)
A short position would focus on risks related to corporate governance, substantial debt, intense competition, and a history of financial vulnerability.
Corporate Governance and Related-Party Risks: The Garcia Parties control a majority of the voting power, making Carvana a "controlled company" exempt from certain NYSE governance requirements. There is a significant business relationship with DriveTime, an entity also controlled by the Garcia Parties, for critical services like VSC administration and facility leases. These arrangements were not negotiated at arm's length, creating potential conflicts of interest.
Substantial Indebtedness: As of December 31, 2024, the company had approximately $5.5 billion in total outstanding debt. This level of debt could affect financial flexibility, requires significant cash flow for service payments, and contains restrictive covenants that could limit future actions.
Dependence on Volatile Markets: The business is highly dependent on the sale of retail vehicles and the sale of automotive finance receivables it originates, making it susceptible to downturns in the used car market, rising interest rates, and changes in the capital markets. The company has a history of significant net losses, and sustained long-term profitability is not guaranteed.
Intense Competition and Legal Scrutiny: Carvana operates in a highly fragmented and competitive industry, facing pressure from traditional dealers like CarMax and online marketplaces. The company is also subject to numerous legal proceedings and government inquiries, including from various state Attorneys General, regarding its business practices.
Equity Dilution and Stock Volatility: The market price of Carvana's stock has been extremely volatile. The company has actively used its "at-the-market" (ATM) program to sell stock, raising $1.3 billion in 2024 but also causing dilution for existing shareholders.
Business Overview:
Carvana Co. (NYSE: CVNA) is a leading e-commerce platform dedicated to revolutionizing the used car market by simplifying the processes of buying and selling vehicles. The company's vertically integrated business model combines a comprehensive online shopping experience with a sophisticated in-house supply chain, aiming to provide customers with a broad selection, competitive value, and transparent pricing in a low-pressure environment.
Core Business Operations:
Carvana's business model is structured to manage the entire vehicle transaction cycle, from acquisition to after-sale support, primarily through its digital platform.
Vehicle Acquisition and Preparation:
Sourcing: Carvana acquires its inventory of used vehicles directly from customers, as well as from wholesale auctions and other suppliers. This direct sourcing from customers helps to eliminate auction fees and diversify their vehicle offerings.
Inspection and Reconditioning: Upon acquisition, vehicles are transported to one of Carvana's Inspection and Reconditioning Centers (IRCs). Each vehicle undergoes a thorough inspection of its features, brakes, tires, and cosmetic appearance. Vehicles that meet Carvana's uniform standards are reconditioned, while those that do not are sold through wholesale channels.
Sales and Fulfillment:
Online Platform: The company's mobile-optimized website, carvana.com, serves as the primary retail channel, featuring a vast inventory of vehicles. A key feature is the patented 360-degree virtual vehicle tour, which uses high-definition photography to display both the interior and exterior of the actual vehicle, including any imperfections.
Financing and Ancillary Products: Carvana offers integrated financing solutions through a proprietary platform that provides customers with pre-qualified terms without impacting their credit score until a purchase is finalized. In addition to vehicle sales, the company generates revenue from complementary products such as Vehicle Service Contracts (VSCs), Guaranteed Asset Protection (GAP) waivers, and auto insurance offered in partnership with Root, Inc..
Nationwide Logistics and Fulfillment: A proprietary logistics network, built on a "hub and spoke" model, enables efficient transportation of vehicles across the country. Customers can opt for home delivery via a branded Carvana hauler or choose to pick up their vehicle from one of the company's distinctive, patented car vending machines.
Customer-Centric Approach: Carvana emphasizes a simple and transparent customer experience, backed by a seven-day return policy and dedicated post-sale support from customer advocates. This focus on customer satisfaction has resulted in high average customer ratings and fosters repeat business and referrals.
The company's primary strategy revolves around increasing retail vehicle unit sales, which drives revenue from vehicle transactions, financing, and the sale of complementary products and services. By leveraging technology and a vertically integrated model, Carvana aims to achieve significant operating leverage and disrupt the traditionally fragmented automotive retail industry.
Based on Carvana's 2024 annual filing, the company's revenue is primarily categorized into three main streams: retail vehicle sales, wholesale sales and revenues, and other sales and revenues. For the fiscal year ending December 31, 2024, Carvana's total revenue was approximately $13.67 billion.
How They Make Money:
Revenue Breakdown by Category
A detailed breakdown of Carvana's revenue for the year ended December 31, 2024, is as follows:
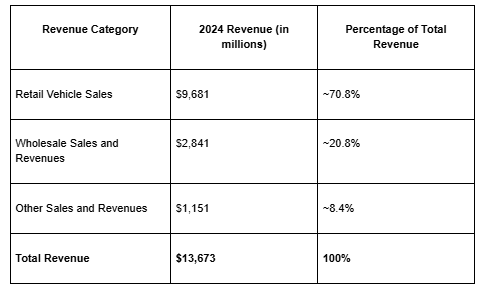
Table data sourced from Carvana's 2024 Annual Report.
Description of Revenue Categories
Retail Vehicle Sales: This is Carvana's largest revenue source, generated from the sale of used vehicles to customers through its online platform. This category also includes shipping and delivery fees.
Wholesale Sales and Revenues: This revenue is generated from selling vehicles acquired from customers to wholesalers. It also includes revenue from the sale of wholesale marketplace units by non-Carvana sellers through its wholesale platform, which includes auction fees and related service revenues. The acquisition of ADESA in 2022 has significantly contributed to this segment by expanding Carvana's wholesale auction capabilities.
Other Sales and Revenues: This category primarily consists of income from:
Gains on the sales of loans: Generated from originating and then selling automotive finance receivables to third-party finance partners or through securitization transactions.
Commissions on complementary products: This includes commissions on Vehicle Service Contracts (VSCs), Guaranteed Asset Protection (GAP) waiver coverage, and auto insurance sold through its platform. Carvana has a partnership with Root, Inc. for its auto insurance offerings. A significant portion of VSC commissions are from an agreement with DriveTime.
Subsidiary and Brand Information
ADESA: Acquired in May 2022, ADESA's U.S. physical auction business is a key part of Carvana's wholesale operations. For the year ended December 31, 2023, ADESA operations contributed approximately $856 million to wholesale sales and revenues.
DriveTime: While a separate entity, Carvana has a significant business relationship with DriveTime, a related party. This includes a master dealer agreement where Carvana earns commission on VSCs administered by DriveTime.
Root, Inc.: Carvana has a partnership with this online insurance company to offer integrated auto insurance to its customers. Revenue from this partnership is included in "Other Sales and Revenues".
It is important to note that all of Carvana's revenue is generated within the United States.
History of Revenue and Margins:
Based on Carvana's (CVNA) 2024 annual report, the company has seen significant shifts in revenue and margins, driven by a combination of fluctuating sales volume, strategic shifts in pricing, and a strong focus on operational efficiency.
Revenue Performance
Carvana's total revenue has experienced volatility in recent years. After reaching a peak in 2022, revenue declined in 2023 before rebounding in 2024.
2022: Total revenue was $13.6 billion.
2023: Total revenue decreased to $10.8 billion.
2024: Total revenue increased to $13.7 billion.
The primary driver of these revenue changes has been the volume of retail units sold. The increase in revenue in 2024 was primarily due to a 33.1% increase in retail vehicles sold, from 312,847 in 2023 to 416,348 in 2024. This increase in volume was partially offset by a decrease in the average retail revenue per unit sold, which fell from $24,018 in 2023 to $23,252 in 2024. This decline in average selling price was partly due to a higher proportion of retail marketplace units, which are recognized on a net revenue basis.
The acquisition of ADESA's U.S. physical auction business in May 2022 also impacted revenue, significantly expanding Carvana's infrastructure and enhancing its wholesale operations. This is reflected in the growth of wholesale sales and revenues, which increased to $2.8 billion in 2024 from $2.5 billion in 2023, driven by a greater number of wholesale units sold.
Margin Expansion
Carvana has demonstrated significant improvement in its profitability, with both gross and net margins expanding considerably.
Total Gross Profit per Unit: $3,022 in 2022, $5,511 in 2023, and $6,908 in 2024.
Net Income Margin: -21.3% in 2022, 1.4% in 2023, and 3.0% in 2024.
Adjusted EBITDA Margin: -7.7% in 2022, 3.1% in 2023, and 10.1% in 2024.
The expansion in margins can be attributed to several factors, including lower vehicle acquisition costs, improved operational efficiencies, and operating leverage.
Gross Margin Improvement: The increase in retail vehicle gross profit per unit to $3,312 in 2024 from $2,385 in 2023 was a key driver of overall margin expansion. This was achieved through:
Lower Raw Material Costs: The company experienced lower vehicle acquisition costs relative to sales prices. A key part of its strategy is to increase the number of vehicles purchased directly from customers, which are, on average, more profitable than those acquired at auction.
Reduced Labor and Operational Costs: Carvana reported lower reconditioning and inbound transport costs on vehicles sold during 2024. The company aims to better utilize its existing inspection and reconditioning infrastructure, which has the capacity to handle over 1 million vehicles per year.
Faster Inventory Turn: A reduction in the average number of days to sell a vehicle also contributed to higher gross profit by minimizing vehicle price reductions due to depreciation.
Operating Leverage: While total Selling, General, and Administrative (SG&A) expenses increased to $1.9 billion in 2024 from $1.8 billion in 2023 due to higher sales volume, the company demonstrated improved operating leverage. Total SG&A expenses per retail unit decreased from $5,741 in 2023 to $4,501 in 2024. This indicates that the company's centralized online sales model and existing infrastructure are allowing it to scale sales more efficiently without a proportional increase in overhead costs.
Key Performance Indicators
Company-Defined Key Operating Metrics
Carvana regularly reviews several key metrics to evaluate its business, measure progress, and make strategic decisions. The company states that its most important long-term measure of performance is the number of retail units sold.
Retail Units Sold
This is defined as the number of vehicles sold to customers in a given period, net of returns under the company's seven-day return policy. Carvana views this as a key measure of growth, as it is the primary driver of revenue and enables multiple complementary income streams.
Trend:
2014: 2,105
2015: 6,523
2016: 18,761
2017: 44,252
2018: 94,108
2019: 177,549
2020: 244,111
2021: 425,237
2022: 412,296
2023: 312,847
2024: 416,348
Total Gross Profit per Unit
This metric is defined as the aggregate gross profit in a given period divided by the retail units sold in that period. It includes gross profit from retail vehicle sales, gains on loan sales, commissions on complementary products, and gross profit from wholesale vehicle sales.
Trend:
2014: $ (201)
2015: $ 206
2016: $ 1,023
2017: $ 1,539
2018: $ 2,090
2019: $ 2,852
2020: $ 3,253
2021: $ 4,537
2022: $ 3,022
2023: $ 5,511
2024: $ 6,908
Total Gross Profit per Unit, non-GAAP
This is defined as the aggregate non-GAAP gross profit in a given period divided by retail units sold. Non-GAAP gross profit adds back depreciation, amortization, and restructuring expenses in cost of sales, and share-based compensation, while subtracting revenue related to Root Warrants.
Trend:
2014: $ (201)
2015: $ 206
2016: $ 1,013
2017: $ 1,537
2018: $ 2,136
2019: $ 2,878
2020: $ 3,298
2021: $ 4,593
2022: $ 3,337
2023: $ 5,984
2024: $ 7,196
Average Monthly Unique Visitors
This is defined as an individual who has visited Carvana's website or mobile application within a calendar month. The company views this as a key indicator of its brand strength and the effectiveness of its advertising campaigns.
Trend:
2023: 15,819 (in thousands)
2024: 17,248 (in thousands)
Total Website Units
This is the number of vehicles listed on the company's website on the last day of a reporting period. This metric is a key measure of growth as it indicates the selection available to consumers and the company's ability to scale its vehicle purchasing and reconditioning operations.
Trend:
2023: 33,075
2024: 53,360
Other Key Business Metrics
The annual report also provides historical data for other financial and operational metrics that are crucial to understanding the business's performance.
Total Revenue
This represents the total net sales and operating revenues generated by the company.
Trend (in millions):
2014: $42
2015: $130
2016: $365
2017: $859
2018: $1,955
2019: $3,940
2020: $5,587
2021: $12,814
2022: $13,604
2023: $10,771
2024: $13,673
Adjusted EBITDA Margin
Adjusted EBITDA is a non-GAAP measure defined as net income (loss) adjusted for items such as interest expense, taxes, depreciation, amortization, and other specific expenses or gains. The margin is Adjusted EBITDA as a percentage of total revenues.
Trend:
2014: (31.0)%
2015: (24.6)%
2016: (23.0)%
2017: (16.1)%
2018: (9.2)%
2019: (5.2)%
2020: (4.0)%
2021: 0.5%
2022: (7.7)%
2023: 3.1%
2024: 10.1%
Carvana IRC & Integrated ADESA Sites
This metric reflects the growth of the company's physical infrastructure, including Inspection and Reconditioning Centers (IRCs) and integrated ADESA auction sites.
Trend (Total Sites):
2014: 2
2015: 3
2016: 3
2017: 4
2018: 5
2019: 7
2020: 11
2021: 14
2022: 17
2023: 17
2024: 24 (18 Carvana IRCs and 6 Integrated ADESA Sites)
Competition and Moat:
Main Competitors
Carvana operates in the highly fragmented and competitive used car marketplace. The company categorizes its current and future competitors as follows:
Traditional Used Vehicle Dealerships: This includes major players like CarMax.
Internet and Online Automotive Sites: A broad category that includes Amazon, AutoTrader, Cars.com, Carfax, CarGurus, eBay Motors, Edmunds, Google, KBB, and TrueCar.
New and Used Vehicle Dealers: This includes dealers that have their own e-commerce business or online platforms.
Automobile Manufacturers: Companies such as Ford, General Motors, Toyota, Volkswagen, Tesla, Rivian, and Lucid are listed as potential competitors.
Offline Services: This includes membership-based car-buying services like the Costco Auto Program.
Other Marketplaces: This includes platforms that could compete with Carvana's own wholesale marketplace program.
Private Transactions: The company also competes with privately negotiated vehicle sales between individuals.
Carvana's Competitive Moat: Why The Company Believes It Can Win
Carvana states that its primary competitive advantages stem from its "Purpose-Built Vertically Integrated E-commerce Platform". This model is designed to provide a better customer experience while operating at a lower cost than traditional dealerships. The company's competitive moat is built on the following pillars:
Cost Advantage: Carvana believes its proprietary technology and vertically integrated business model result in a "significantly lower variable cost structure versus traditional dealerships". By controlling all critical operations—from vehicle acquisition to reconditioning, financing, and logistics—the company aims to operate more efficiently. Its scaled infrastructure has the capacity to inspect and recondition more than one million cars per year at full utilization.
Network Effects: The business benefits from powerful network effects driven by scale. Carvana offers customers a "nationally pooled inventory of over 53,000 high-quality used vehicles". This large selection increases the probability that a customer will find their desired vehicle, which in turn attracts more customers to the platform.
Proprietary Technology and Patents: Technology is central to Carvana's operations.
The company holds 41 issued U.S. patents covering its vending machine technology, photo technology, website user interface, and artificial intelligence, among others.
Its patented, automated photo technology creates a 360-degree virtual tour of each vehicle, which it believes generates the trust needed for customers to buy a car online.
A proprietary financing platform, trained on over a decade of Carvana's loan data, provides customers with nearly instantaneous and flexible credit terms without impacting their credit score until a purchase is finalized.
Brand and Differentiated Experience: Carvana focuses on creating a "transparent and simplified solution to car buying".
It offers a distinctive fulfillment experience through home delivery on a branded hauler or pickup at one of its patented, multi-story car vending machines.
The company believes these vending machines provide a unique pickup experience that develops brand awareness.
A seven-day return policy and a high customer satisfaction rating (averaging 4.7 out of 5.0 stars from over 215,000 surveys) are key to building brand trust and generating referrals.
Forward Strategy:
Carvana's 2024 Annual Report outlines a multi-faceted strategy centered on achieving profitable growth by focusing on innovation, deeper penetration into existing markets, and developing new products, while also keeping acquisitions as a potential tool.
Overall Strategy: Profitable Growth
After a period of focusing on operational efficiency and profitability in 2022 and 2023, management states that in 2024 they shifted "towards the long-term phase of driving profitable growth." This strategy aims to balance scaling the business with enhancing customer experiences and improving efficiency. The foundation of this strategy remains increasing retail vehicle unit sales, which drives multiple revenue streams.
In his letter to shareholders, CEO Ernie Garcia emphasizes that the company will remain "hungry and foolish," indicating a continued commitment to ambitious and aggressive goals. The plan is to build a business at a scale not yet seen in the automotive industry by delivering the best customer experiences.
Key Strategic Pillars:
Innovation and Technology
A core component of Carvana's strategy is to innovate and extend its technological leadership. Management intends to make significant investments in technology to improve and expand its customer offerings, believing the complexity of auto retail provides substantial opportunities for differentiation.
Key areas of innovation include:
New Products and Services: Carvana plans to leverage its e-commerce and logistics platform to introduce new complementary products and services, such as different insurance products, leasing, or maintenance.
Process Improvement: The company states it will "relentlessly focus on creatively finding solutions for our customers, building them, and continually improving them." This includes constantly improving how they predict customer demand and optimize vehicle pricing.
Technology Leadership: Carvana highlights its custom-built technology portfolio, from its inventory management system and patented photo technology to its proprietary financing platform, as a key competitive advantage that it plans to build upon.
Market Expansion and Penetration
Instead of rapidly expanding into new geographic markets, the company's strategy focuses on increasing its market share within its existing footprint.
Deeper Market Penetration: A primary strategy is to "Increase Sales Through Further Penetration of Our Existing Markets." This will be achieved by actively building brand awareness and improving operational speed and efficiency in the markets they already serve.
Leveraging Existing Infrastructure: Management notes that it has the physical infrastructure, including Inspection and Reconditioning Centers (IRCs), with the capacity to recondition over one million vehicles per year, which will support continued growth.
Acquisitions
While not listed as a primary focus in its "Business and Growth Strategies" section, the report indicates that acquisitions remain a potential component of Carvana's broader strategy.
The company acknowledges it "may continue to acquire other companies or technologies."
The 2022 acquisition of ADESA is cited as a key strategic move that provided significant infrastructure for future growth, with 56 additional locations that could be developed to increase reconditioning capacity.
Capital Allocation:
Carvana's Capital Allocation: A Look at Historical Investments and Financing
Carvana's historical capital allocation strategy has been heavily geared towards fueling rapid growth, expanding its physical infrastructure, and managing its debt. A cornerstone of this strategy was the significant acquisition of ADESA's U.S. physical auction business, alongside substantial debt and equity financing activities.
Major Acquisition: ADESA U.S.
A pivotal moment in Carvana's recent history was the acquisition of ADESA's U.S. physical auction business on May 9, 2022.
Purchase Price: Carvana acquired ADESA for approximately $2.2 billion in cash.
Strategic Assets: The deal brought 56 auction locations across the United States under Carvana's control, significantly expanding its physical footprint with 6.5 million square feet of buildings on over 4,000 acres of land. This acquisition was intended to enhance Carvana's customer offering by providing a broader selection of vehicles and enabling faster delivery times.
Financing the Deal: The acquisition was financed through the proceeds from the issuance and sale of its 2030 Senior Unsecured Notes.
Goodwill: The transaction resulted in the recognition of $838 million in goodwill, which is tax-deductible.
Debt and Equity Financing
Carvana has actively utilized both debt and equity markets to fund its operations and strategic initiatives. As of December 31, 2024, the company's total outstanding debt was approximately $5.5 billion.
Debt Instruments:
Senior Secured Notes: The bulk of Carvana's debt is in Senior Secured Notes with varying maturity dates and interest terms.
2028 Senior Secured Notes: $611 million outstanding with a 9% cash interest rate after an initial PIK (Payment-In-Kind) period.
2030 Senior Secured Notes: $1,660 million outstanding with a 9% cash interest rate following a PIK and toggle interest period.
2031 Senior Secured Notes: $1,982 million outstanding with a 9% cash interest rate after a PIK period.
Senior Unsecured Notes: As of year-end 2024, Carvana had $205 million in outstanding Senior Unsecured Notes with interest rates ranging from 4.875% to 10.250%.
Debt Exchange: In a significant move to manage its liabilities, Carvana executed an exchange offer in September 2023, swapping $5.5 billion of Senior Unsecured Notes for $4.2 billion of new Senior Secured Notes and $341 million in cash.
Asset-Based Financing: The company also relies on various asset-based financing facilities:
A $1.5 billion floor plan facility to finance its vehicle inventory.
$4.2 billion in total commitment across several finance receivable facilities.
$482 million in real estate financing through sale and leaseback arrangements as of the end of 2024.
Equity Issuances:
At-the-Market (ATM) Program: In the fiscal year 2024, Carvana raised $1.3 billion in gross proceeds by issuing 6.8 million shares of its Class A common stock through its ATM program at a weighted-average price of $186.56 per share.
Private Placement: In August 2023, entities associated with the Garcia family made a $126 million equity investment in the company, the proceeds of which were used to partially fund a tender offer for some of the company's senior notes.
Overall Capital Deployment
Carvana's capital has been primarily deployed to:
Fuel Growth and Expansion: This includes entering new markets and funding strategic moves like the ADESA acquisition.
Enhance Operational Efficiency: Facing market shifts in 2022 and 2023, the company focused on profitability by improving its operational cost structure.
Manage and Restructure Debt: The company has actively managed its debt profile through exchanges and repurchases.
Support General Corporate Needs: Proceeds from financings are also allocated to working capital and other general corporate purposes
Risks and Changes In Risk:
Carvana's 2024 annual report outlines a wide array of risks to its business, with several notable changes and additions compared to its 2023 filing, reflecting an evolving automotive and economic landscape. The primary risks revolve around macroeconomic conditions, competition, operational execution, and reliance on technology and data.
Summary of Risks to Carvana's Business (2024)
Carvana's business is subject to numerous risks that can be broadly categorized as follows:
Business and Economic Risks:
Macroeconomic Conditions: The company's performance is sensitive to the broader automotive ecosystem and economic trends, including consumer demand, supply chain issues, inflation, and interest rates that affect vehicle affordability.
Competition: The used car market is highly competitive and fragmented, with pressure from traditional dealerships, online marketplaces like Amazon, and new and used vehicle dealers with e-commerce platforms.
Inventory Management: Acquiring desirable used vehicles at favorable prices and expeditiously selling that inventory are crucial. Failure to do so can lead to depreciation and over-supply risks.
Growth and Profitability: After a period of rapid growth, the company has shifted its focus to profitability and operational efficiency. There is no guarantee of returning to historical growth rates, and failure to manage growth effectively could harm the business.
Brand and Reputation: Maintaining a positive reputation for integrity and customer service is critical, and failure to do so could impact customer trust and demand.
Reliance on Key Relationships: The company maintains a business relationship with DriveTime and its affiliates for services such as the administration of vehicle service contracts (VSCs).
Operational and Regulatory Risks:
Regulatory Environment: Carvana operates in highly regulated industries and is subject to a wide range of federal, state, and local laws. Changes in these regulations or failure to comply could result in penalties and operational disruptions.
Logistics: The business relies on a combination of internal and external logistics to transport its vehicle inventory, exposing it to risks associated with the transportation industry.
Legal Proceedings: Carvana is subject to various legal proceedings, claims, and investigations which could have a material adverse effect on the business.
Technology and Cybersecurity Risks:
Cybersecurity and Data Privacy: The company collects, processes, and stores sensitive personal information, making it vulnerable to security breaches and subject to evolving privacy laws. The use of artificial intelligence (AI) also introduces new risks.
Technology Reliance: The business is highly dependent on its technology networks and infrastructure, including its website and mobile applications. Disruptions could harm the business.
Intellectual Property: Protection of proprietary technology, such as algorithms and its vending machine design, is crucial to maintaining a competitive advantage.
Financial and Structural Risks:
Indebtedness: Carvana has substantial indebtedness, which could affect its financial flexibility and ability to incur additional debt.
Automotive Finance Receivables: A significant portion of the company's gross profit depends on the sale of automotive finance receivables it originates.
Organizational Structure: As a holding company, Carvana's principal asset is its interest in Carvana Group, and it depends on distributions from this entity to pay taxes and expenses. Conflicts of interest could arise between stockholders and LLC Unitholders.
Changes in Risk Disclosures from 2023 to 2024
While many of the core risks remained consistent between the 2023 and 2024 annual reports, there were several key changes and additions in the 2024 filing:
Artificial Intelligence (AI): A notable addition to the 2024 report is the explicit mention of risks associated with the use of AI. The report highlights potential cybersecurity, data privacy, and labor and employment risks stemming from both third-party generative AI platforms and internal software. It also notes the risk of inadvertent disclosure of proprietary information through AI tools.
Refined Macroeconomic Risks: The 2024 report provides more specific examples of macroeconomic challenges, such as the impacts of inflationary pressures on costs and scarcity of certain products which have affected vehicle prices and consumer demand.
Emphasis on Profitability Initiatives: Both reports mention a shift in focus to profitability, but the 2024 report elaborates on how this shift impacts various aspects of the business, including a move towards a long-term phase of driving profitable growth.
Cybersecurity Disclosures: The 2024 report includes a more detailed disclosure on cybersecurity risk management, governance, and strategy, in line with new SEC rules. This includes the role of the Board's Audit Committee and the Chief Information Security Officer (CISO).
Tax Asset Preservation Plan: The 2023 report detailed a Tax Asset Preservation Plan to protect NOL carryforwards. The 2024 filing notes the termination of this plan in June 2024, as it was determined to no longer be necessary.
Short Seller and "Short Squeeze" Risks: The 2023 report included a specific risk factor related to manipulative practices by short sellers and the potential for a "short squeeze" to cause extreme price volatility. While still a general market risk, this is not highlighted with its own specific subsection in the main risk factor summary of the 2024 report.
Updated Financial Figures: All financial figures related to debt, revenue, and profitability have been updated to reflect the full fiscal year 2024 results, showing changes in the company's financial position and performance. For instance, total debt as of December 31, 2024, was $5.5 billion, down from $6.0 billion at the end of 2023.
In conclusion, while the fundamental risks to Carvana's business remain largely the same, the 2024 annual report reflects a company navigating a challenging economic environment with a heightened focus on profitability and grappling with new technological risks like those posed by AI.
Key Partners, Suppliers, and Customers:
Carvana (CVNA) has key relationship risks and dependencies with several partners and suppliers that are critical to its operations, particularly DriveTime Automotive Group, Inc., and its financing partners like Ally Financial.
Key Relationship Risks and Dependencies
DriveTime Automotive Group, Inc. Carvana has a significant and multifaceted business relationship with DriveTime, a related party controlled by Carvana's controlling stockholders, the Garcia Parties. The risk factor section explicitly states that the arrangements with DriveTime cannot be assumed to have been negotiated at arm's length and there is no assurance the arrangements will continue on similar terms, if at all.
Key dependencies on DriveTime include:
Vehicle Service and Warranty Administration: DriveTime administers the Vehicle Service Contracts (VSCs) that Carvana sells to its customers. Carvana earns a commission on these sales and is entitled to profit-sharing revenues based on performance. DriveTime also administers the limited warranty provided with every vehicle purchase.
Servicing of Finance Receivables: DriveTime performs ongoing servicing and administrative functions for the automotive finance receivables that Carvana originates.
Real Estate Leases: Carvana leases critical facilities, including inspection and reconditioning centers in Texas, New Jersey, and Georgia, from DriveTime.
Wholesale Vehicle Transactions: DriveTime purchases wholesale vehicles from Carvana through competitive auctions.
Financing Partners (Notably Ally Financial) Carvana's business model is heavily dependent on its ability to sell the automotive finance receivables it originates, as this accounts for a substantial portion of its gross profit.
Ally Bank and Ally Financial Inc. (Ally Parties): Carvana has a Master Purchase and Sale Agreement (MPSA) with the Ally Parties to sell a significant volume of its finance receivables.
Under the MPSA, Carvana sold $3.0 billion of finance receivables in 2024 and $3.6 billion in 2023.
The agreement was amended to reestablish a commitment by the Ally Parties to purchase up to $4.0 billion of finance receivables between January 2025 and January 2026.
Securitization and Capital Markets: Beyond specific partners, Carvana relies on its access to capital markets to sell receivables through securitization transactions. A material decline in access to these markets at competitive rates could harm the business.
Vehicle and Parts Suppliers Carvana's ability to operate is dependent on acquiring desirable vehicles and the parts needed to recondition them.
Vehicle Sourcing: The company acquires its inventory from various sources, including customers, used car auctions, and wholesale used vehicle suppliers. A reduction in the availability or access to these inventory sources could have a material adverse effect on business and sales.
Inventory Financing: The company relies on agreements with third parties, such as the Floor Plan Facility with the Ally Parties, to finance its vehicle inventory purchases. A failure to extend these agreements could reduce inventory supply.
Insurance Partner (Root, Inc.) Carvana has partnered with Root, Inc. to provide an integrated auto insurance solution on its e-commerce platform. While this provides a complementary revenue stream, Carvana's influence over Root is limited, and its inability to control Root's operations could result in receiving less benefit than expected from the commercial relationship.
Technology and Marketing Partners Carvana has a broad dependency on a variety of external technology and marketing services.
Traffic and Lead Generation: The company depends on internet search engines, lead generators, social networking sites, and vehicle listing sites to drive traffic to its website.
Third-Party Technology: Carvana relies on third-party technology for functions such as its website's network infrastructure and customer interaction software. Its technology footprint is significantly hosted in third-party data center facilities it does not control.
Debt and Funding:
Carvana (CVNA) funds its operations through cash generated from sales, financing activities, and has undertaken specific measures to manage its debt and liquidity.
Funding of Operations and Financial Health
How Operations Are Funded Carvana generates cash from several primary sources:
The sale of retail and wholesale vehicles.
The sale of auto loans it originates for customers.
Sales commissions on complementary products like Vehicle Service Contracts (VSCs) and GAP waiver coverage.
Financing activities, including short-term revolving credit facilities, real estate and equipment financing, and the issuance of debt and equity securities.
In 2024, the company utilized an "at-the-market offering" (ATM) program, issuing 6.8 million shares of Class A common stock for gross proceeds of $1.3 billion, which is being used for general corporate purposes.
Operational Cash Flow The core business's ability to self-fund, as measured by cash flow from operations, has shown significant improvement.
2024: Net cash provided by operating activities was $918 million. The increase from the prior year was primarily due to improved operating results and a $274 million reduction in cash interest paid, partially offset by increased inventory acquisitions.
2023: Net cash provided by operating activities was $803 million.
2022: Net cash used in operating activities was ($1,324) million.
This trend indicates a significant turnaround from a large cash deficit in 2022 to generating substantial positive cash flow from its core operations in 2023 and 2024.
Cash Position and Liquidity Management believes that its current working capital, cash flows from operations, and available financing arrangements will be sufficient to fund operations for at least the next 12 months.
As of December 31, 2024, Carvana's available liquidity resources included:
Cash and cash equivalents: $1,716 million.
Availability under short-term revolving facilities: $1,879 million.
Total committed liquidity resources available: $3,595 million.
The company's total liquidity potential, which also includes additional secured debt capacity and unpledged assets, was $5.7 billion at the end of 2024, a significant increase from $3.1 billion at the end of 2023.
Debt Structure and Ability to Pay
As of December 31, 2024, Carvana was in compliance with all its debt covenants. The company actively managed its debt profile in 2024 by repurchasing and cancelling $370 million and redeeming $100 million of its 2028 Senior Secured Notes.
The total outstanding principal amount of indebtedness was $5.5 billion as of December 31, 2024. A detailed breakdown of the debt is as follows:
Asset-Based Financing ($0.9 billion total)
Floor Plan Facility: Used to finance vehicle inventory.
Amount Outstanding: $67 million.
Terms: Interest at a prime rate plus a spread; secured by vehicle inventory and other assets. Matures in April 2025.
Finance Receivable Facilities: Used to fund auto loans before they are sold.
Amount Outstanding: $0 (down from $555 million in 2023).
Terms: Various revolving facilities with maturities extending to 2025 and 2026.
Financing of Beneficial Interests in Securitizations:
Amount Outstanding: $354 million.
Terms: Secured by retained interests in securitizations with expected repurchases from October 2025 to December 2032.
Real Estate Financing:
Amount Outstanding: $485 million.
Terms: From sale and leaseback transactions accounted for as financing, with initial terms of 20 to 25 years.
Senior Notes ($4.6 billion total)
Senior Secured Notes:
Amount Outstanding: $4.4 billion (including $105 million of accrued payment-in-kind interest).
Terms: Interest is payable semi-annually. For the first year, interest was paid-in-kind (PIK), adding to the principal balance. For the 2028 and 2030 notes, the company has switched to cash interest payments as of February 2025.
2028 Notes ($0.6B): 12% PIK, now 9% cash interest.
2030 Notes ($1.7B): 13% PIK, now 9%/11% cash/PIK toggle.
2031 Notes ($2.0B): 14% PIK, now --/14% cash/PIK toggle.
Senior Unsecured Notes:
Amount Outstanding: $205 million.
Terms: Fixed interest rates ranging from 4.875% to 10.250%.
Debt Maturities The aggregate principal maturities for the company's long-term debt as of December 31, 2024, are as follows:
2025: $235 million.
2026: $98 million.
2027: $94 million.
2028: $670 million.
2029: $43 million.
Thereafter: $4,157 million.
Seasonality:
Carvana's business is subject to seasonal fluctuations that affect both vehicle sales and prices.
Sales Volume Seasonality:
Peak Season: Used vehicle sales typically peak late in the first calendar quarter. This timing coincides with the issuance of federal government tax refunds.
Low Season: Sales generally diminish throughout the rest of the year, with the fourth calendar quarter expected to have the lowest relative level of sales.
Company Growth vs. Seasonality: Due to its history of rapid growth, Carvana's overall sales patterns have not always mirrored the general seasonality of the industry. However, as the business matures, the company expects its results to become more reflective of typical market seasonality.
Vehicle Price Seasonality:
Used vehicle prices also demonstrate seasonal trends, primarily related to the rate of depreciation.
Vehicles generally depreciate at a faster rate during the fourth and first quarters of the year.
The rate of depreciation is typically slower in the second and third quarters.
Equity Dilution:
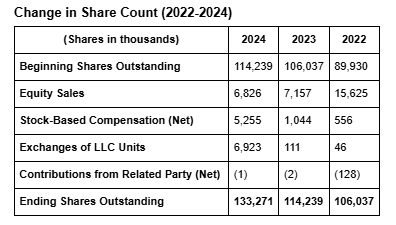
Carvana (CVNA) Class A common share count has increased significantly from the end of 2021 to the end of 2024, primarily driven by equity sales and stock-based compensation. The total number of Class A common stock shares outstanding grew from 89,930,000 at the end of 2021 to 133,271,000 at the end of 2024.
Here is a breakdown of the changes in Carvana's share count over the last three years:
Change in Share Count (2022-2024)
Breakdown of Share Count Changes:
Equity Sales: Carvana has actively raised capital through the sale of its Class A common stock.
2024: 6,826,000 shares were issued through its "at-the-market offering" (ATM) program, generating gross proceeds of $1.3 billion.
2023: 7,157,000 shares were issued via the ATM program for gross proceeds of $336 million.
2022: 15,625,000 shares were issued through equity offerings, raising $1.227 billion net of expenses.
Stock-Based Compensation: A significant portion of the increase in share count is attributable to compensation for employees and directors.
2024: A net of 5,255,000 shares were issued, comprising 4,834,000 shares to settle vested restricted stock units (RSUs) and 440,000 shares from the exercise of stock options, offset by 19,000 forfeited or surrendered shares.
2023: A net of 1,044,000 shares were issued, including 1,057,000 for vested RSUs and 17,000 from exercised options, less 30,000 forfeited shares.
2022: A net of 556,000 shares were issued, which included 390,000 for RSUs, 88,000 for options exercised, and 86,000 under the Employee Stock Purchase Plan (ESPP), offset by 8,000 forfeited shares.
Executive Compensation: The annual report does not provide a specific breakdown of stock-based compensation between executives and other employees. This information is typically found in the company's definitive proxy statement, which is not included in the provided document. However, the report does mention that performance-based RSUs are granted to certain executive employees, indicating they are a component of the overall stock-based compensation figures.
Acquisitions: The provided 2024 annual report does not indicate any significant acquisitions paid for with company stock during the 2022-2024 period. The major acquisition of ADESA's U.S. physical auction business in May 2022 was funded with approximately $2.2 billion in cash, which was raised through the issuance of debt, not equity.
Exchanges of LLC Units: Carvana has a corporate structure where holders of LLC Units in Carvana Group can exchange their units for shares of Class A common stock of Carvana Co..
In 2024, 8,685,000 LLC Units were exchanged for 6,923,000 shares of Class A common stock.
In 2023, 34,000 LLC Units were exchanged for 31,000 shares of Class A common stock.
In 2022, the exchange of LLC units resulted in the issuance of 46,000 shares of Class A common stock
Non-GAAP Adjustments:
Based on Carvana's 2024 Annual Report, the company reports several non-GAAP (Generally Accepted Accounting Principles) financial metrics to supplement its consolidated financial statements . Carvana's management uses these metrics to measure the operating performance of the business as a whole and believes they are useful to investors because they exclude certain financial, capital structure, and non-cash items that may not directly reflect core operations .
Here is a summary of the non-GAAP metrics, their adjustments, and the logic provided for their use:
Adjusted EBITDA and Adjusted EBITDA Margin
Definition:
Adjusted EBITDA is defined as net income (or loss) with several adjustments .
Adjusted EBITDA Margin is Adjusted EBITDA shown as a percentage of total revenues .
Logic for Use: Carvana uses this metric to measure its operating performance . The company believes it is a useful measure for investors because it excludes certain items that are not indicative of recurring operations, allowing for more effective period-over-period evaluation and comparison with competitors .
Adjustments from Net Income (Loss): To calculate Adjusted EBITDA, the following items are added back to or subtracted from Net Income (Loss) :
Additions:
Income tax (benefit) provision
Interest expense
Depreciation and amortization expense (from both cost of sales and SG&A)
Share-based compensation expense (from both cost of sales and SG&A)
Goodwill impairment
Restructuring expense
Loss on debt extinguishment
Other operating expense, net
Subtractions:
Gain on debt extinguishment
Revenue related to Root Warrants
Other (income) expense, net
Gross Profit, non-GAAP and Total Gross Profit per Retail Unit, non-GAAP
Definition:
Gross Profit, non-GAAP is defined as GAAP gross profit with adjustments for certain non-cash items and restructuring costs included in the cost of sales .
Total Gross Profit per Retail Unit, non-GAAP is the non-GAAP Gross Profit divided by the number of retail vehicle units sold .
Logic for Use: This metric is used to measure operating performance relative to retail unit sales . Management believes excluding certain non-cash items provides a clearer view of the core operational profitability per vehicle sold .
Adjustments from Gross Profit: The calculation for Gross Profit, non-GAAP involves the following adjustments to GAAP Gross Profit :
Additions:
Depreciation and amortization expense in cost of sales
Share-based compensation expense in cost of sales
Restructuring expense in cost of sales
Subtraction:
Revenue related to Root Warrants
SG&A Expenses, non-GAAP and Total SG&A Expenses per Retail Unit, non-GAAP
Definition:
SG&A Expenses, non-GAAP is defined as GAAP Selling, General, and Administrative (SG&A) expenses, excluding depreciation and amortization, share-based compensation, and restructuring costs .
Total SG&A Expenses per Retail Unit, non-GAAP is SG&A expenses, non-GAAP divided by the number of retail vehicle units sold .
Logic for Use: These measures help evaluate the core operating expenses of the business relative to retail sales volume, excluding certain non-cash and non-recurring items .
Adjustments from SG&A Expenses: The calculation for SG&A Expenses, non-GAAP involves the following adjustments to GAAP SG&A Expenses :
Subtractions:
Depreciation and amortization expense in SG&A
Share-based compensation expense in SG&A
Restructuring expense in SG&A
Carvana cautions that these non-GAAP measures may not be comparable to similarly titled metrics provided by other companies due to potential differences in calculation methods .
Changes From Prior Year:
Based on a comparison of Carvana's 2023 and 2024 annual reports, here are the most significant changes:
Strategic and Leadership Tone
A notable shift occurred in the company's strategic focus and the tone of its leadership.
From Survival to Growth: The 2023 report emphasized resilience and the successful navigation of significant hardship, focusing on achieving profitability through operational efficiency and expense reduction. The 2024 report signals a strategic shift from survival to pursuing "profitable growth".
Return to "Hungry and Foolish": The 2024 CEO letter embraces the "hungry and foolish" ambition that characterized Carvana's early days, acknowledging that this approach led to challenges in 2022 but is essential to its mission of large-scale disruption. This contrasts with the 2023 letter's focus on the "resilient people" who weathered the company's stock drop.
Financial Performance and Position
Carvana's financial results showed a significant positive turn, moving from stabilization to growth.
Resumption of Growth: After a sharp decline in 2023, retail units sold increased by 33.1% in 2024, rising from 312,847 to 416,348. Total revenue followed, growing 26.9% to $13.673 billion in 2024 from $10.771 billion in 2023.
Improved Profitability: The company built upon its 2023 profitability.
Net Income: Increased to $404 million in 2024, up from $150 million in 2023.
Gross Profit Per Unit (GPU): Total GPU, a key metric, rose to $6,908 in 2024 from $5,511 in 2023. Retail vehicle GPU specifically increased to $3,312 from $2,385.
Adjusted EBITDA: More than quadrupled, reaching $1.378 billion in 2024 compared to $339 million in 2023.
Strengthened Balance Sheet:
Debt Reduction: Total debt decreased from approximately $6.0 billion in 2023 to $5.5 billion in 2024, partly due to the repurchase and redemption of $470 million of its Senior Secured Notes. This followed a major debt exchange in 2023 that had already significantly lowered the debt burden.
Increased Liquidity: Cash and cash equivalents grew substantially to $1.716 billion at the end of 2024, up from $530 million at the end of 2023.
Operational Scale
The company's operational footprint expanded significantly in 2024 after contracting in 2023.
Inventory Growth: Total vehicles available on its website grew to over 53,000 by the end of 2024, a sharp increase from approximately 33,000 at the end of 2023.
Employee Headcount: Total full-time and part-time employees increased to over 17,400 in 2024 from over 13,700 in 2023.
Infrastructure Integration: Carvana advanced the integration of its ADESA auction sites, converting six of them to provide Inspection and Reconditioning Center (IRC) capabilities, bringing the total number of production sites to 24.
Technology and Risk
The 2024 report reflects the increasing role of Artificial Intelligence in Carvana's operations and the associated risks.
Intellectual Property: The company reported holding 41 issued U.S. patents as of December 31, 2024, up from 32 in the prior year. The 2024 report specifically notes that patents now cover artificial intelligence technology.
New Risk Factors: The 2024 report introduces risks associated with rapidly advancing generative AI technology, noting its uncertain impact and potential to introduce new vulnerabilities.
Red Flags:
Here is a list of potential red flags for investors:
Financial Performance and Profitability
History of Net Losses: The company has a history of significant net losses, reporting a net loss of $2.894 billion in 2022, although this narrowed to a net income of $150 million in 2023 and $404 million in 2024. A history of substantial losses can indicate challenges in achieving sustained profitability.
Dependence on Vehicle Sales for Revenue: A majority of Carvana's revenue is driven by retail vehicle unit sales. This makes the company highly susceptible to fluctuations in the used car market and consumer demand.
Sensitivity to Vehicle Prices: The business is sensitive to changes in the prices of new and used vehicles. An increase in used vehicle prices could make them less affordable for customers, while a decrease could reduce the company's gross profit on inventory.
Fluctuating Gross Profit Per Unit: While total gross profit per unit increased to $6,908 in 2024 from $5,511 in 2023, this key metric can fluctuate based on inventory acquisition costs, reconditioning expenses, and vehicle depreciation. The company's ability to maintain and grow this metric is crucial for long-term profitability.
Debt, Liquidity, and Capital Resources
Substantial Indebtedness: As of December 31, 2024, Carvana had a significant amount of outstanding debt, including $4.4 billion in Senior Secured Notes and $205 million in Senior Unsecured Notes. This substantial debt could affect financial flexibility and requires a significant portion of cash flow for debt service payments.
Dependence on External Financing: The company relies on the sale of automotive finance receivables for a substantial portion of its gross profit. Access to capital markets at competitive rates is critical, and any decline could harm the business. Carvana also uses an "at-the-market" (ATM) program to sell stock for capital.
Restrictive Debt Covenants: The indentures governing the company's Senior Secured Notes contain restrictive covenants that could limit its ability to incur additional debt, pay dividends, or make certain investments.
Risk of Additional Capital Needs: Carvana states it may require additional capital to fund its objectives, and this capital may not be available on acceptable terms, or at all.
Operational and Market Risks
Highly Competitive Industry: The used car market is highly fragmented and competitive. Carvana faces competition from traditional dealerships like CarMax, online marketplaces like AutoTrader and Cars.com, and even major companies like Amazon.
Macroeconomic Headwinds: The business is affected by broader economic conditions, including inflation, recessions, and consumer disposable income. The report notes that changes in the economy, market, and industry in 2022 and 2023 prompted a shift in focus to driving profitability over growth.
Inventory Acquisition and Management: The company's success depends on its ability to acquire desirable used vehicles at competitive prices. Obstacles to acquiring sufficient inventory could materially harm the business.
Cybersecurity and Data Privacy Risks: Carvana collects and stores sensitive customer data, including personally identifiable information and financial details. A breach of cybersecurity measures could lead to financial losses, reputational damage, and legal liabilities.
Corporate Governance and Related-Party Transactions
Controlled Company Status: The Garcia Parties control a majority of the voting power of Carvana's capital stock, making it a "controlled company" under NYSE rules. This exempts Carvana from certain corporate governance requirements, such as having a majority of independent directors. This concentration of control could lead to decisions that may not align with the interests of other stockholders.
Relationship with DriveTime: Carvana has a significant business relationship with DriveTime, an entity also controlled by the Garcia Parties. This includes agreements for vehicle servicing, leases, and administration of Vehicle Service Contracts (VSCs). These arrangements were not negotiated at arm's length, and their terms could change or be terminated, potentially impacting Carvana's operations and costs.
Tax Receivable Agreement (TRA): Carvana has a Tax Receivable Agreement with its LLC Unitholders that requires substantial cash payments to them in respect of certain tax benefits. These payments could reduce cash flow available for reinvestment in the business. As of December 31, 2024, the TRA liability was $82 million.
Legal and Regulatory Scrutiny
Extensive Regulation: Carvana operates in a highly regulated industry, subject to federal, state, and local laws governing vehicle sales, financing, advertising, and data privacy.
Legal Proceedings and Investigations: The company is involved in various legal proceedings, claims, and government inquiries. This includes lawsuits related to securities laws, consumer protection, and the timely delivery of vehicle titles and registrations. State Attorneys General have also conducted inquiries into the company's practices.
And for posterity:
 Sticker")