
$CVNA Earnings Prep

More testing of the good old AI MCP skills and tools for CVNA.
For what it’s worth this quarter shouldn’t be too notable results wise. Expecting ~199k units which is right about in line of estimates. July so far is on track for ~40% YoY growth which is a slight uptick from some slightly slower Q2 growth in May/June.
The company continues to grow rapidly at great economics. Kudos to the team and happy to continue owning the shares.
CVNA — Q2 FY2026 Earnings Prep
Reporting Date: Wednesday, July 29, 2026 (After Market Close)
Conference Call: 5:30 p.m. ET
What to Expect
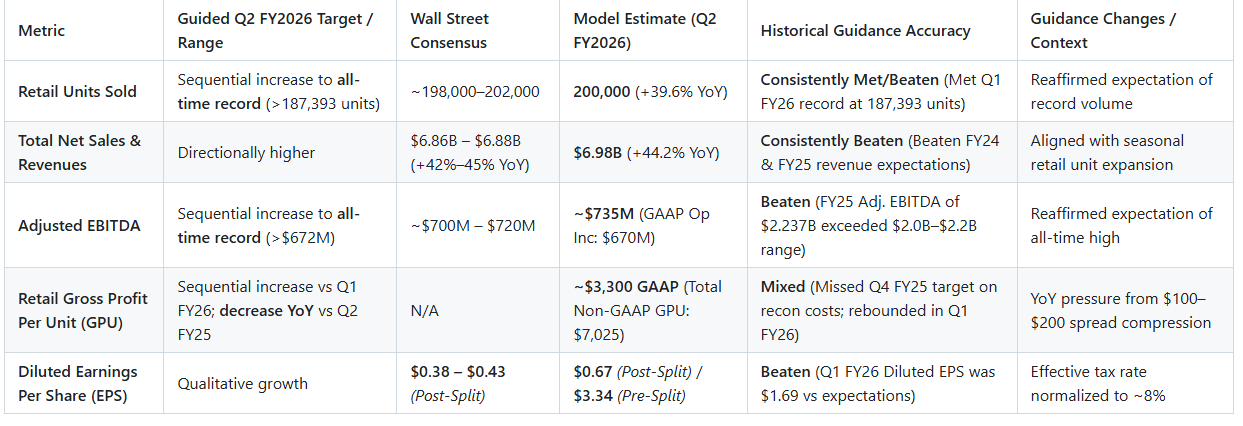
Record Retail Unit Sales (~200,000 Units): Driven by peak Q2 spring/summer buying seasonality, expanded Inspection & Reconditioning Center (IRC) throughput (1.5M unit annual built-out capacity), and accelerated market share gains (1.6% full-year 2025 baseline). Management guided to a sequential increase over Q1 FY2026’s record of 187,393 units (+40.0% YoY). The model projects 200,000 retail units (+39.6% YoY).
All-Time High Adjusted EBITDA & Operating Profit Expansion: CFO Mark Jenkins guided to a sequential increase in Adjusted EBITDA beyond Q1 FY2026’s record of $672M. With high structural conversion of Adjusted EBITDA to GAAP Operating Income (~90%), GAAP Operating Income is projected to reach $670M (+31.1% YoY from $511M in Q2 FY2025), supported by fixed cost leverage and sustained monetization in finance/ancillary services.
Retail GPU Sequential Recovery vs. Year-over-Year Headwinds: Management explicitly cautioned that Retail GPU will expand sequentially from Q1 FY2026 ($3,165 GAAP) but drop YoY compared to Q2 FY2025. This YoY margin compression reflects a $100–$200 per-unit headwind from narrower industry wholesale-to-retail price spreads, non-vehicle inflation, and the lapsing of prior-year tariff benefits (~$100/unit). Total Non-GAAP GPU is modeled at $7,025/unit.
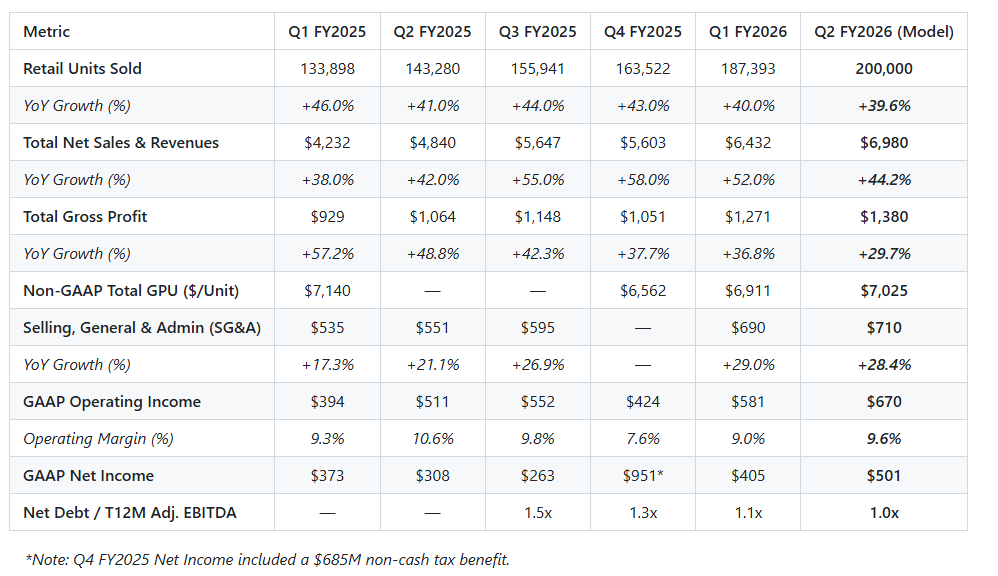
SG&A Cost Discipline Following Q1 Step-Up: After SG&A overhead stepped up to $690M in Q1 FY2026, management characterized Q1 as establishing a stable “new baseline level” rather than the start of accelerated expense growth. The model projects Q2 FY2026 operating expenses at $710M (+28.4% YoY), driving operating leverage as total revenue scales +44.2% YoY to $6.98B.
Accelerated Balance Sheet Deleveraging: Net debt to trailing 12-month Adjusted EBITDA declined to 1.1x in Q1 FY2026 (down from 1.5x in Q3 FY2025). Peak seasonal cash generation and earnings expansion in Q2 are expected to reduce leverage to 1.0x, bringing Carvana closer to investment-grade credit metrics.
Guidance & Consensus
Note on Stock Split: Carvana executed a 5-for-1 forward stock split on May 7, 2026. Post-split consensus EPS estimates reflect this change (~$0.38–$0.43 per share), while pre-split historical figures are noted where appropriate.
Historical Trends
(Values in millions of USD, except per-share and per-unit data)
*Note: Q4 FY2025 Net Income included a $685M non-cash tax benefit.
Trajectory Highlights & Margin Inflections
Volume Acceleration: Retail units sold expanded from 133,898 units in Q1 FY2025 to 187,393 units in Q1 FY2026 (+40% YoY), with market share expanding to 1.6%.
Operating Leverage Trend: After SG&A peaked as a percentage of revenue during early restructuring, SG&A overhead declined to -0.93% YoY in FY2025. Despite a sequential bump in Q1 FY2026 to $690M (driven by stock-based compensation vesting, winter weather, and AI tech investments), operating margin is projected to re-expand to 9.6% in Q2 FY2026.
Deleveraging Path: Net Debt / Trailing 12M Adjusted EBITDA improved from 1.5x in Q3 FY2025 to 1.1x in Q1 FY2026, driven by cumulative Adjusted EBITDA growth ($2.237B in FY2025).
Segment & KPI Outlook
1. Retail Vehicle Sales
Recent Trajectory: Revenue grew from $2,980M in Q1 FY2025 to $4,828M in Q1 FY2026 (+62.0% YoY). Retail units sold hit consecutive record highs, reaching 187,393 in Q1 FY2026.
Management Commentary: CEO Ernie Garcia highlighted that fastest-turnaround vehicle processing dropped below 5 days from purchase to retail listing. Annual built-out reconditioning capacity stands at 1.5M units across 34 capable locations.
Q2 FY2026 Expectation: Retail unit volume is expected to reach 200,000 units (+39.6% YoY), generating ~$5.25B in retail vehicle revenue.
2. Wholesale Vehicle Sales
Recent Trajectory: Revenue expanded from $863M in Q1 FY2025 to $1,078M in Q1 FY2026 (+24.9% YoY). Wholesale unit volume reached 83,574 units in Q1 FY2026 (+31.7% YoY), generating $1,328 in Wholesale GPU per unit.
Management Commentary: Transition to the ADESA Clear digital auction platform and integration of ADESA physical sites (10 mega sites integrated in 2025; targeting 6–8 in 2026 at $30M–$35M per site) continue to boost wholesale marketplace efficiency.
Q2 FY2026 Expectation: Wholesale volume will track higher trade-in volumes alongside record retail sales, with revenue projected at ~$1.15B.
3. Other Sales & Revenues (Finance & Ancillary)
Recent Trajectory: Revenue increased from $389M in Q1 FY2025 to $526M in Q1 FY2026 (+35.2% YoY), yielding $2,807 in Other GPU per retail unit.
Management Commentary: Carvana secured $12B in 2-year institutional loan purchase agreements ($4B new partner agreement through Dec 2027, plus $6B with Ally through Oct 2026). End-to-end automation tool “Sebastian” now enables >30% of retail buyers and >60% of vehicle sellers to complete transactions with zero human contact.
Q2 FY2026 Expectation: Other GPU is expected to hold near ~$2,800/unit, driving total segment revenue to ~$560M on higher retail volume.
4. Operations & Reconditioning Cost Efficiency
Recent Trajectory: Operations SG&A per retail unit dropped to $1,549 in Q2 FY2025 before experiencing a temporary spike in Q4 FY2025 due to rapid facility scaling.
Management Commentary: In Q1 FY2026, management deployed new software algorithms, manager decision tools, and labor productivity tracking across IRC facilities, bringing April labor efficiency close to all-time company bests.
Q2 FY2026 Expectation: Reconditioning efficiency gains will flow through to inventory, stabilizing total Non-GAAP GPU at $7,025/unit.
Recent Developments
1. Corporate Actions & Stock Split
5-for-1 Forward Stock Split: Carvana completed a 5-for-1 stock split on May 7, 2026. Post-split trading settled in the $67–$80 range (equivalent to $335–$400 pre-split).
2. Competitor Read-Throughs
CarMax (KMX) Q1 FY2027 Earnings (June 17, 2026): CarMax reported a $230 YoY decline in retail GPU ($2,177/unit) due to price cuts aimed at preserving unit volume. CVNA stock dipped ~8%–10% in sympathy. However, analysts noted Carvana’s volume growth (+40% YoY vs flat/negative comp sales at CarMax) and vertical GPU integration provide structural insulation.
3. Infrastructure & Operational Expansion
ADESA Hybrid Expansion: Added full Inspection & Reconditioning capabilities at ADESA Sarasota (June 2026) and ADESA Chicago (May 2026).
Delivery & Digital Upgrades: Expanded Same-Day Delivery to Milwaukee (July 2026) and launched ADESA Timed, expanding digital B2B auction capabilities.
4. Insider Activity Context
10b5-1 Clustered Sales: Significant insider sales occurred on May 1 and June 1, 2026. CFO Mark Jenkins and COO Benjamin Huston exercised deeply in-the-money options ($2.01, $8.41, $10.39 strike prices post-split) and monetized shares under pre-arranged 10b5-1 plans (CFO sold ~$4.48M in June; COO sold ~$3.52M in June).
Derivative Transaction by Major Shareholder: On May 1, 2026, 10% owner Ernest Garcia II (via ECG II SPE, LLC) sold 4,000,000 covered call options (2M at $450 strike, 2M at $500 strike pre-split, expiring May 21, 2027), generating $272.23M in cash premiums.
Open Market Buys: Zero open-market purchases were recorded.
Risks & Catalysts
Upside Catalysts
Reconditioning Labor Productivity Gains: Rapid absorption of new software tools across IRCs could lower reconditioning costs faster than anticipated.
Estimated Impact: +$50 to +$100 Retail GPU uplift (+$10M to +$20M Gross Profit).
Finance Monetization & Loan Spreads: Sustained high institutional demand for auto loan originations across the $12B financing pipeline could drive higher loan monetization premiums.
Estimated Impact: +$50 Other GPU uplift (+$10M Gross Profit).
Market Share Outperformance: Retail sales exceeding 205,000 units (+43% YoY).
Estimated Impact: +$175M Revenue / +$30M Adj. EBITDA.
Downside Risks
Wholesale-to-Retail Spread Squeeze: Broader vehicle depreciation could cause the wholesale-to-retail spread compression to exceed the guided $100–$200 range.
Estimated Impact: -$150 Retail GPU (-$30M Gross Profit).
Industry Price Competition (CarMax Read-Through): Promotional price cutting by traditional dealers could pressure retail average selling prices (ASPs).
Estimated Impact: -$100 to -$200 Retail GPU (-$20M to -$40M Gross Profit).
SG&A Overhead Creep: AI and technology investments, combined with peak seasonal marketing spend, pushing operating expenses above $730M.
Estimated Impact: -$20M Operating Income.
Questions for the Call
Wholesale-to-Retail Spread Squeeze: Management guided to a $100–$200 YoY Retail GPU headwind in Q2 from narrower spreads. Has this spread compression stabilized entering Q3, and how is it trending relative to initial expectations?
Reconditioning Labor Efficiency: You noted that labor efficiency in April approached all-time bests following new software tool rollouts. Given that costs lag unit sales, how much of this efficiency gain is recognized in Q2 gross margin versus flowing into Q3 inventory?
Competitive Pricing Environment: Competitors like CarMax reported dropping retail GPU by over $200 per unit to defend volume. How is Carvana balancing volume growth versus retail GPU unit economics in the current pricing environment?
Overhead & Technology Run-Rate: Following the SG&A step-up to $690M in Q1, how should we think about the run-rate for overhead expenses in H2 2026 as AI investments (such as “Sebastian”) continue?
ADESA Buildout Cadence: What is the current construction timeline and cap-ex cadence for the 6 to 8 ADESA full site build-outs planned for FY2026 at $30M–$35M per site?
Balance Sheet & Credit Goals: With Net Debt to Trailing 12-Month Adjusted EBITDA reaching ~1.0x, what are the primary milestones or leverage targets required to achieve investment-grade credit ratings or optimize long-term corporate debt costs?